Deep, clean Blockchain Data Analysis
Sandworm gives you deep, clear, and editable data on various blockchains, driving your whole team to make better data-based decisions.
Trusted by
● Easy intelligence
Most analytics tools are built for engineers, complicated, rigid, and slow. Sandworm brings simplicity and speed to everyone.
Whether you're a protocol team, data analyst, or founder, Sandworm adapts to how you work — not the other way around.
● Built to Last ●

● Explore
Our protocol helps teams hit their data goals, whether it's checking live balances across wallets, gaining on-chain insights into onboarding activities, or comparing activity across several blockchains over any time frame.
Launch App
● Query the blockchain
You can explore over 25+ blockchain networks, comparing data, getting information and building a database, all with natural language prompts.
Explore Queries● Powerful sql
Go beyond static charts, create and tweak pure SQL data which powers your visuals to explore deeper insights, test hypotheses, and uncover new trends instantly.
Launch App
● Let's talk worm AI ●
Use WormAI
Create a bar chart of the tokens with > $1m mcap on Zora in August, 2025


● Accelerate with AI
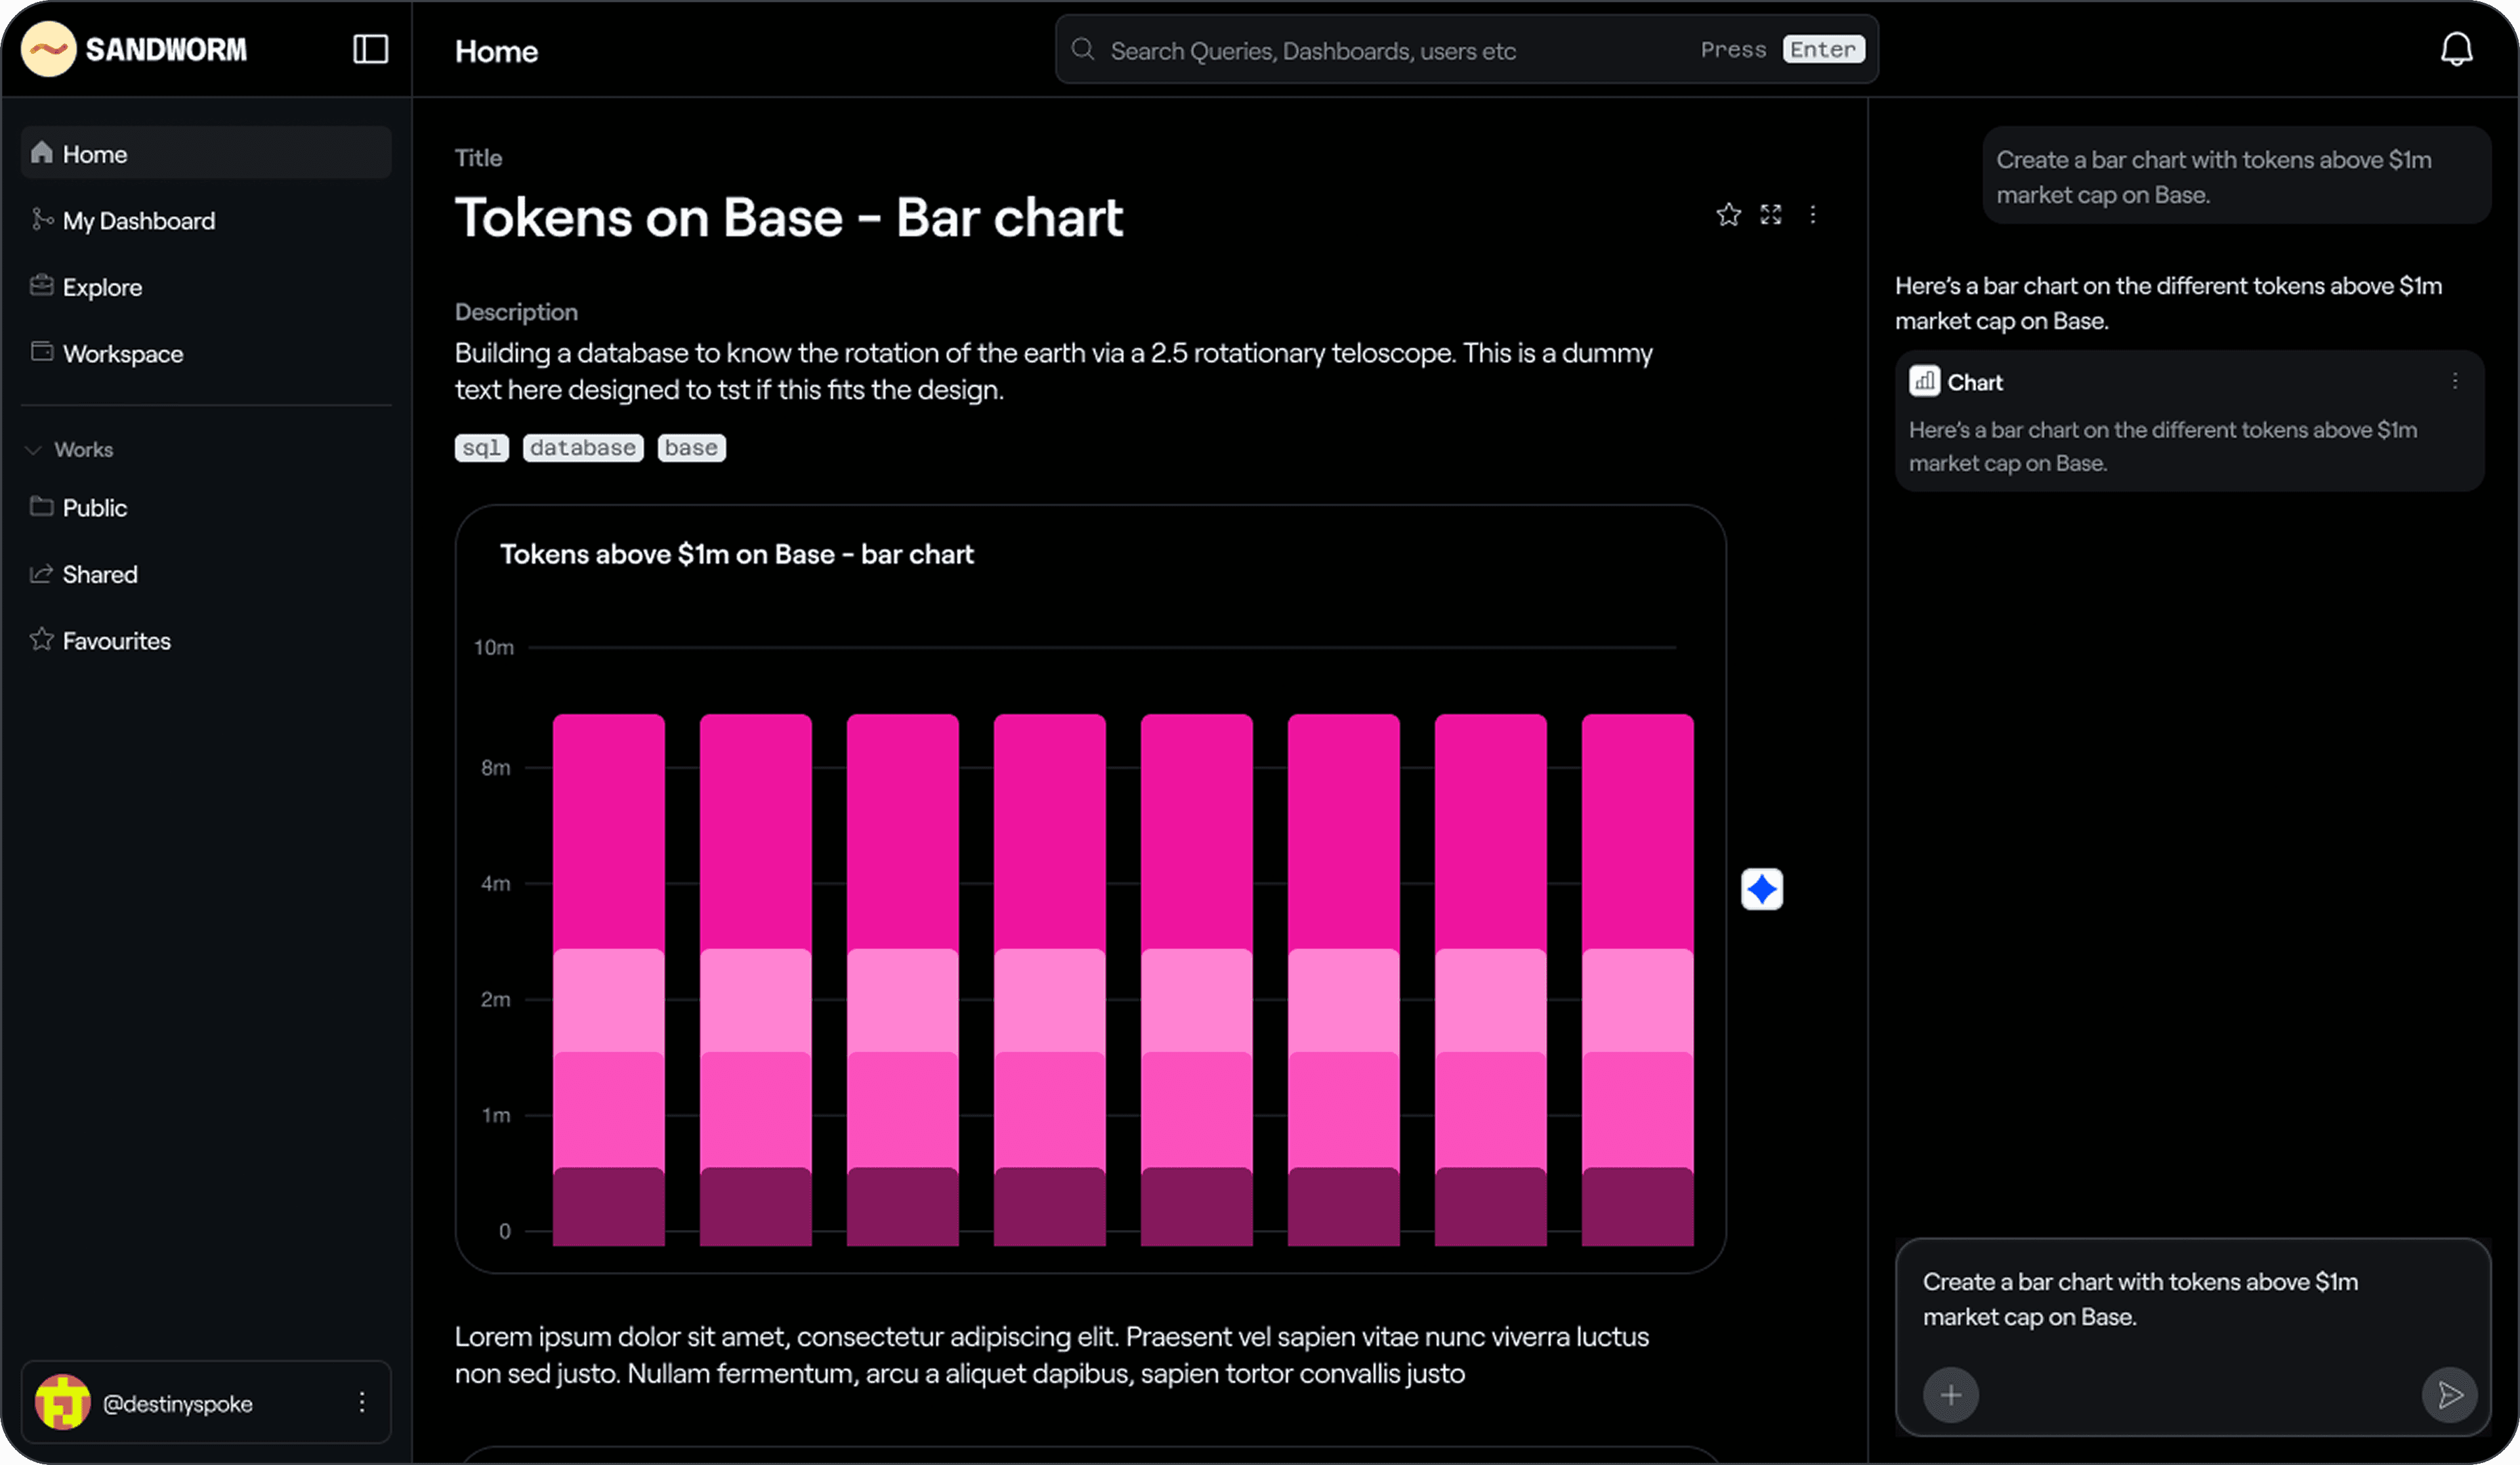
Create Charts
Easily prompt and create charts, comparing, contrasting, analysing data from the blockchain all from a single prompt on our AI.
Query User Data
Get information on user behaviour, insights, transaction statistics, campaign outlook and more easily.
Analyze Price Data
Analyse price action over any period of time to spot trends, systems and underlying issues before others do.

How Sandworm works
1. Create and edit notes
Using our powerful AI, create a full notebook, filled with charts, data points, information and more, all editable, from the raw SQL, to the visualization type.

2. Visualize and store data
View, understand, utilize and store the information you got from using our product.

3. Organize and export notebooks
You can create any amount of dashboard to store your visualizations, add texts, photos etc to personalize it. You can then share or export them.

4. Create and edit notes
Using our powerful AI, create a full notebook, filled with charts, data points, information and more, all editable, from the raw SQL, to the visualization type.
